What is Power BI?
Power BI is a cloud-based data visualization software system that is designed around Power Query and Power Pivot. Power BI is a separate software system than Excel and you will have to download it as a standalone system.
Power BI allows people in data analysis roles, to create interactive reports and dashboards that end users enjoy using. As more and more executives gain experience with data dashboards, Power BI increasingly is the data tool that companies in may sectors are using.
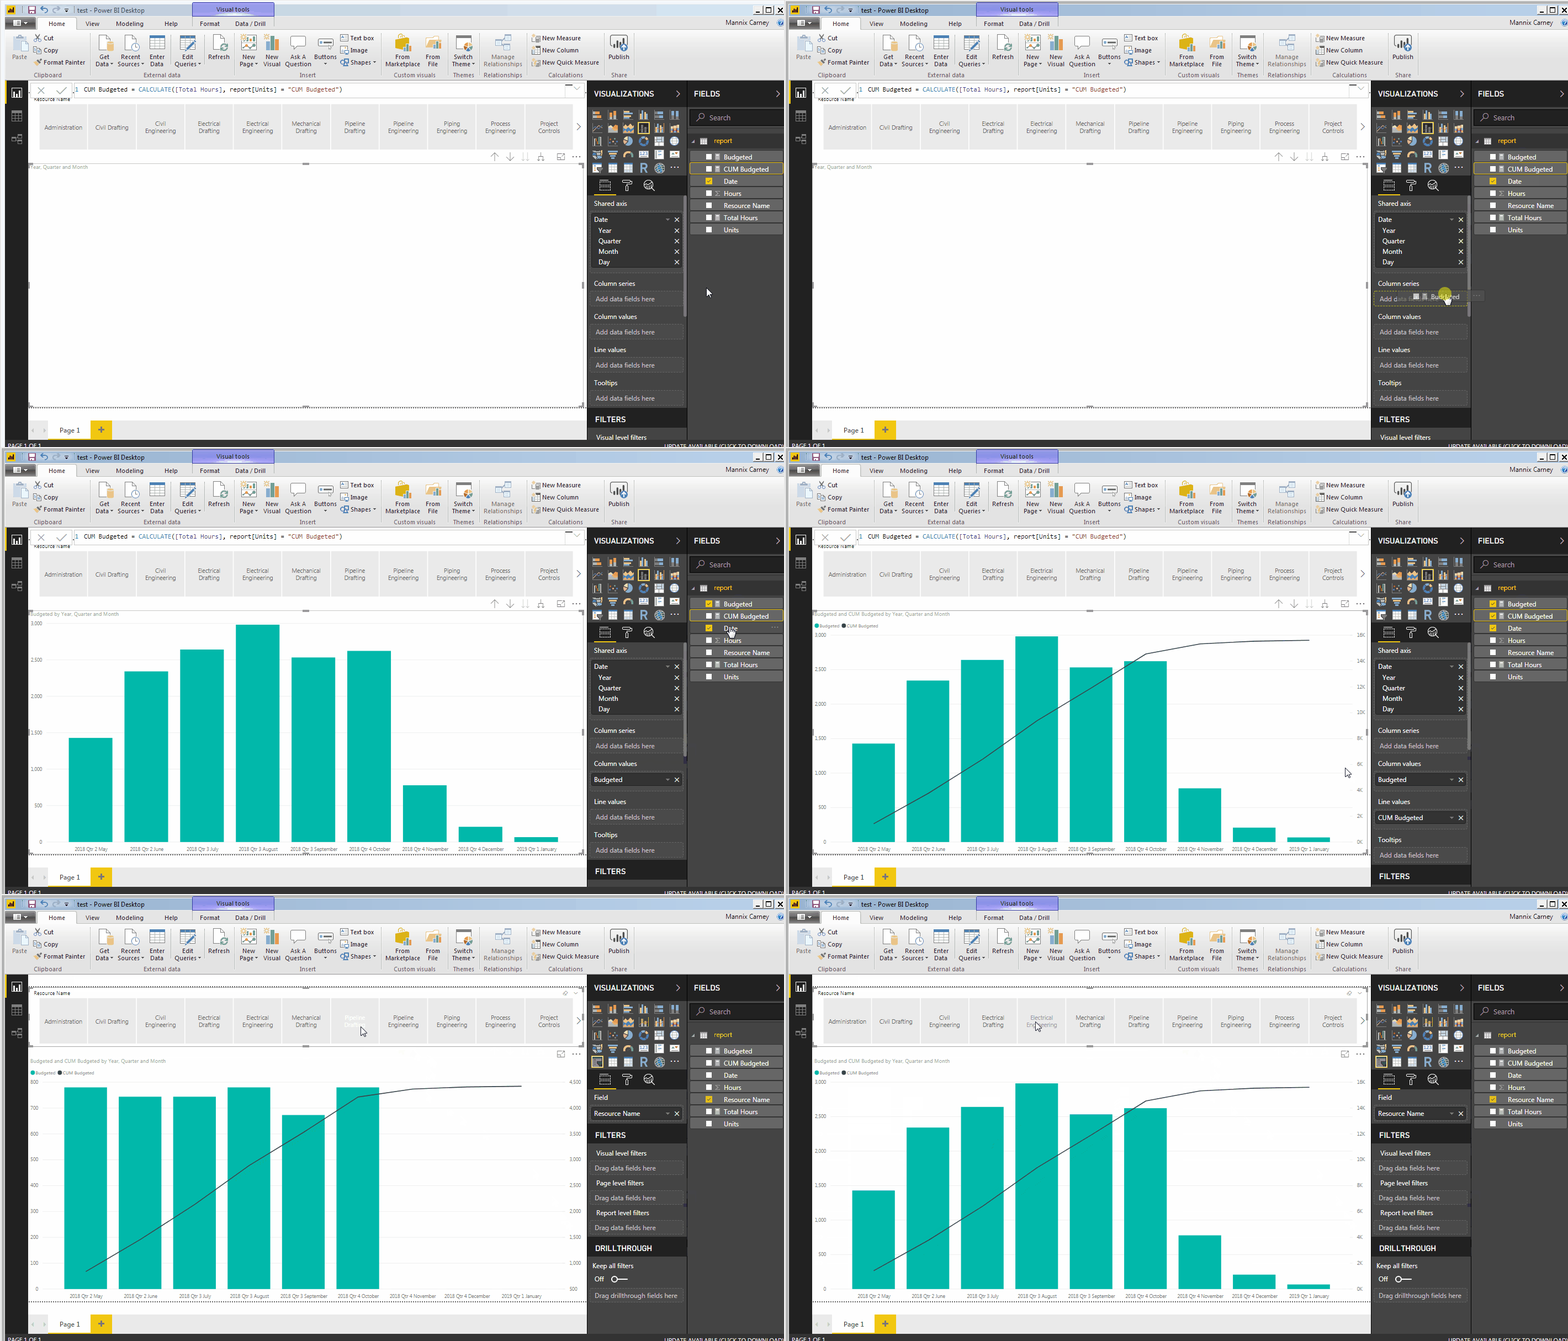
This is an example of a typical project S-Curve created using Primavera P6 data in Power BI.
How to Use Power BI
Once your data has been shaped using Power Query and converted into a Data Model in Power Pivot you can pass the data model to Power BI.There are a whole range of cloud based visualization systems available today. You just have to type data visualization into google and you will be overwhelmed by options.
The reason that I like Power BI is that it is so well-integrated into Excel. The Power Query and Power Pivot tools that we have gone through represent 90% of the work in making a functional dashboard or report.
The Power BI authoring software is a free download. To share the data visualizations that your create you will have to pay approximately $10 per month per report user.
If you set up an efficient Power Query / Power Pivot / Power BI system, you can update your project reports in your usual system (for me this is a combination of Primavera P6 and a set of excel spreadsheets). Then I take a couple of minutes to refresh and check my Power BI connects. When I press publish all the dashboards and reports related to that dataset are instantly updated.
Power BI allows me to replace time-consuming and error prone reports with a superior product, personalized and interactive dashboards.
What can Power BI do for me?
As a project controls professional, Power BI allows you to unlock your data and share it with the people who need to review it. It common to have to create reports using data between different databases that are not perfectly integrated. With Power BI you can create data integrations that generate the reports that you needs.
The visualizations available in Power BI allow you to present your data in ways that make it more likely that people with consume it. The ability to create customized reports and visuals for individual people and groups and then have those reports and visuals automatically update is a key feature of Power BI.
The big benefit that Power BI brings to Project Controls, is that the current siloed data sources can be unleashed, properly understood and acted on.

Hi Sir,
I would like to ask on how to load the p6 data into power bi?.
can i ask for the sample pbix file on this?
Thanks.
Kimmy