What is Power Pivot?
Power Pivot is a powerful yet unappreciated data analysis and modeling tool available right in the Excel environment. It allows you to collect data from different sources and create a connected data model. In practice, this means you can pour all the data out of your existing database systems, connect it in Power Pivot, and start making interesting reports in a really short amount of time.
Its also is at the heart of Power BI. We will talk about that later.
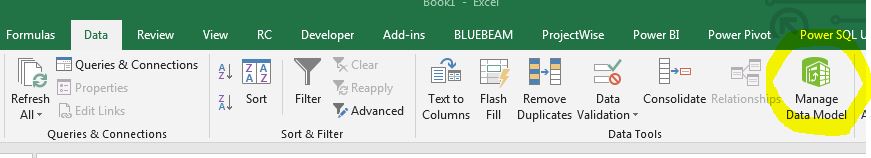
Power Pivot is best understood as a read only database that has been added to the back of Microsoft Excel. The Power Pivot database can be accessed by clicking on the Manage Data Model green icon in the Data tab.
Think about Power Pivot as the “machine” that converts your different data sources into fully finished, interactive reports and visualizations that end users can understand.

It will take you some time to learn how Power Pivot works, but when you do, you will be able to turn your project data into a wide range of dashboards and reports. In practical terms, if you are asked for a report that focuses on a specific part of the project, you can make a working dashboard or report in 15 to 30 minutes.
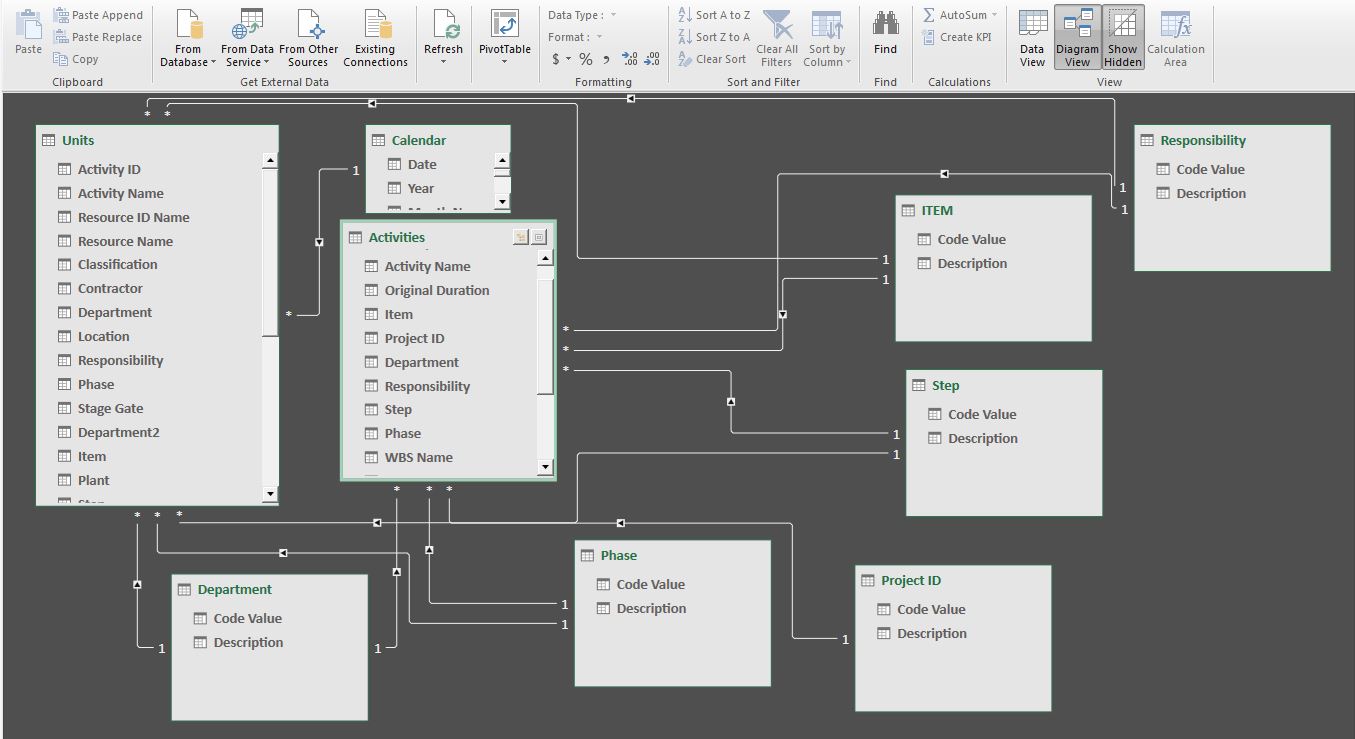
Large data tables can be passed into Power Pivot and, provided that the data is formatted correctly, linked together to create a data model. This allows you to combine different data sources and make meaningful reports. The massive advantage of this approach is that once the data source is correctly shaped and the Power Pivot relationships are correctly applied, you can quickly make all sorts of report tweaks without much rework and with a low chance of error.
This is a screen shot of a connected data model in Power Pivot.
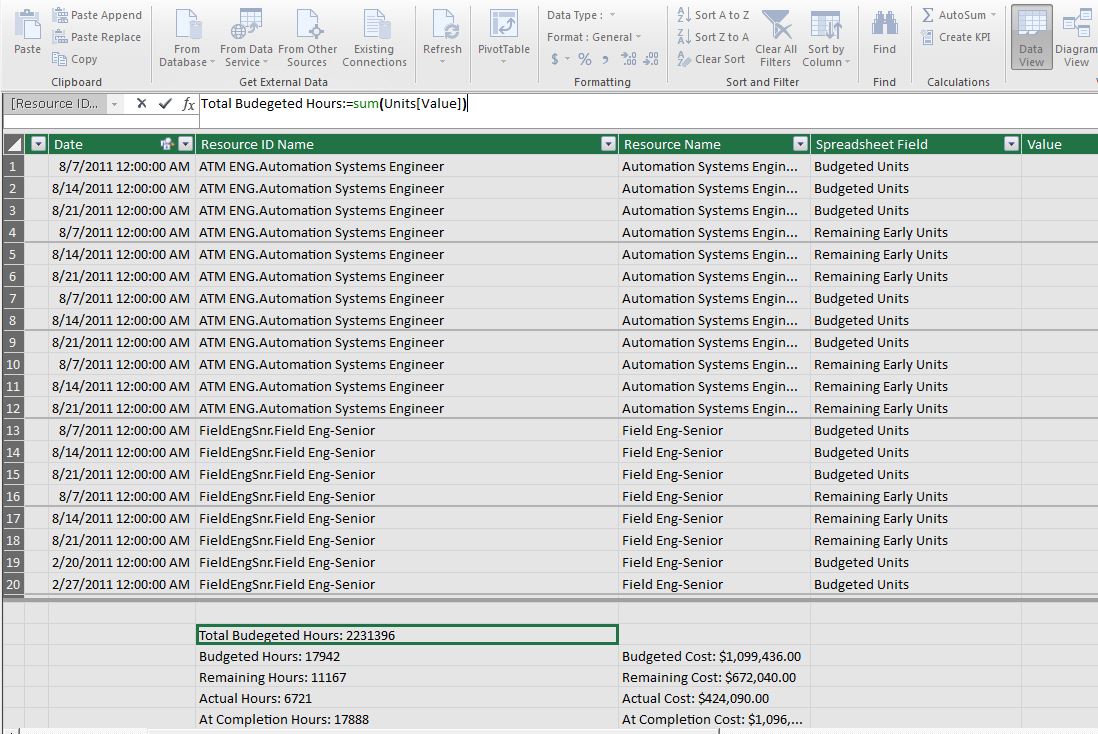
To analyze the data in the data model there are two options. You can write measures or calculated columns. Power Pivot uses a SQL-like querying language called DAX to write the measures and calculated columns.
It has been said that DAX is simple but not easy. If you are familiar with SQL, DAX will come quite naturally. If you are not, it will take some time to get your head around how the language works. Have no fear however, even the simplest DAX formulas will give you powerful report creation skills.
This is an example of a simple SUM measure that I have applied to the Values column in Power Pivot.
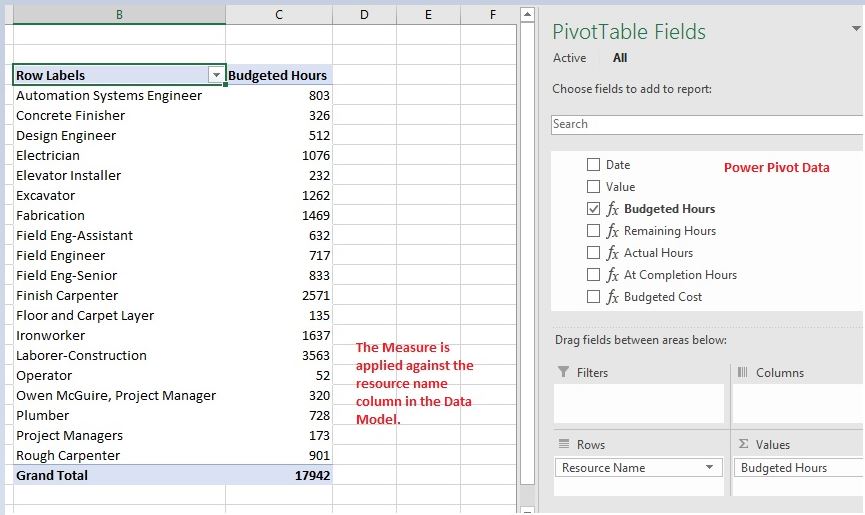
The Power Pivot data can be accessed in Excel like a normal Pivot Table, through the measures and calculated columns.
What can Power Pivot do for me?
In combination with well-formatted data and a little knowledge of the DAX query language, Power Pivot allows you to create a wide range of reports for your project team. The Power Pivot data model can handle millions of rows of data and can scale up to really large projects.
The Power Pivot tools available in Excel are used in Microsoft’s server-based data analytics tools and in Power BI’s new cloud-based analytics suite. The skills that you learn in Power Pivot can help you with your current reporting tasks and set you up to work on larger projects in the future.
I found that creating data models in Power Pivot gave me a much better understanding about how my existing systems worked as databases. Once you start to work with and think in terms of structured data, you start to see how databases like Primavera P6 are set up and how you can use them better.
Learn more about Power Pivot
The base resources that I have found on Power Power are two books and two online courses.
Books
Analyzing Data with Power BI and Power Pivot for Excel (Business Skills)
Online Courses